Published on: April 25, 2024
Line charts vs. Candlestick charts: Which is better in forex trading?

| Table of Content |
| What is a candlestick chart? |
| Advantages of using candlestick charts |
| What is a line chart? |
| Advantages of using line charts |
| Wrapping up |
| Forex trading with amana |
When it comes to forex trading, chart analysis is a fundamental tool used by traders to make informed decisions.
Two popular types of forex chart patterns that are widely used are line charts and candlestick charts. Each has its own strengths and weaknesses, and understanding their differences can greatly benefit traders.
In this blog, we’ll dive into the world of chart trading, explore the nuances of time-based charts, discuss the pros and cons of line and candlestick charts in forex trading, and determine which chart type may be best suited for beginners.
What is a candlestick chart?
A candlestick chart or “Japanese candlesticks” offers more detailed information than a line chart by displaying individual "candles" representing specific time intervals (e.g., day, hour). These candles reveal opening, closing, high, and low prices, with a "body" indicating opening and closing prices and "wicks" or "shadows" representing highs and lows.
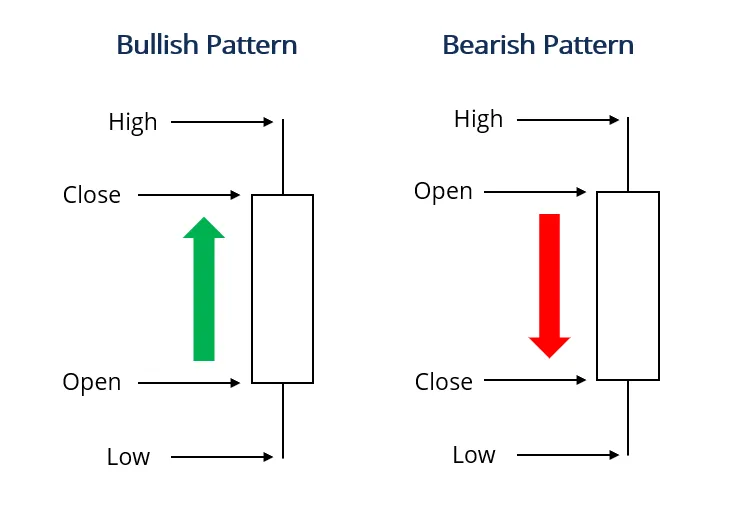
Source: Corporate Finance Institute
Candlestick charts are highly beneficial for technical analysis in financial markets. They unveil price patterns, market sentiment, and potential reversals. Traders leverage candlestick patterns like doji, engulfing patterns, or hammers to spot buying or selling opportunities. The visual depiction of price movements in candlestick charts unveils nuanced information not seen in a line chart.
You can use a candlestick chart when:
- Analyzing financial markets.
- Identifying price patterns, trends, and reversals.
- Analyzing intraday price movements.
- Conducting technical analysis for trading or investment decisions.
Advantages of using candlestick charts
Candlestick charts offer a more comprehensive view of price action. Each candlestick represents the open, high, low, and close prices within a specific time period. Candlestick patterns are widely used by traders to identify potential reversals or continuation patterns in the market.
1. Candlestick charts visually show price movements, helping identify trends, reversals, and key support/resistance levels.
2. They provide crucial data like opening/closing prices and highs/lows, aiding decision-making for traders.
3. Candlestick charts complement technical indicators, offering a comprehensive view of market trends and trade opportunities.
4. Suitable for analyzing any timeframe, making them adaptable for short-term and long-term trading strategies.
What is a line chart?
A line chart is a straightforward method that links data points with a continuous line, typically plotting closing prices at regular time intervals. It's commonly employed to display trends over time and analyze general price movements. Line charts excel in visualizing long-term trends, pinpointing support and resistance levels, and understanding market behavior.
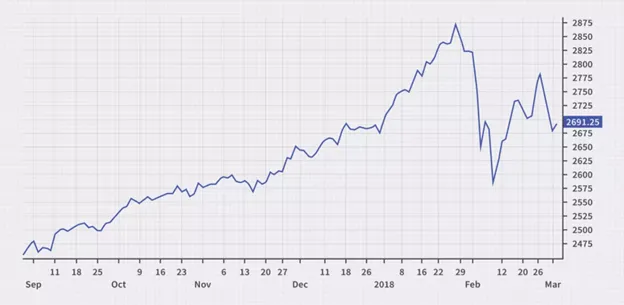
Source: Investopedia
Moreover, line charts are versatile and applicable beyond finance. They serve well in representing time series data across diverse areas such as sales, population trends, or scientific measurements. By emphasizing overall trends, line charts are less focused on intraday price fluctuations or specific price levels.
You can use a line chart when:
- Analyzing long-term price trends.
- Observing general market behavior.
- Visualizing time series data outside of financial contexts.
Ultimately, deciding between a candlestick chart and a line chart hinges on the type of analysis you wish to conduct, and the depth of detail required from the data.
Advantages of using line charts
Line charts provide a simplified view of price movement by connecting closing prices with a line. They are useful for identifying overall trends but may lack detailed information compared to other chart types.
1. Basic, simple, and clear, making it ideal for Forex analysis.
2. Beginner-friendly and easy to grasp for novice traders.
3. Quick trend identification for currency pairs.
4. Filters out market noise for clearer insights.
5. Convenient for updates on the go.
6. Effective for spotting support/resistance levels and graphical patterns.
Read more: Explore forex and currencies on amana.
Wrapping up
In conclusion, what do you think? Which forex trading chart will you probably use? Will you opt for a line chart in your trading endeavors? Do you believe a line chart offers adequate information for your trading strategies? Ultimately, your choice depends on your trading style in the forex market.
If you intend to base your decisions on market commentary and financial news, a line chart could suffice. However, if you seek a comprehensive trading chart that allows the integration of technical indicators like MA, RSI, and Bollinger Bands, then a candlestick chart might be your preferred option.
Forex trading with amana
amana offers a comprehensive forex trading experience with competitive spreads, fast execution, and advanced trading platforms like amana app, amana Web, and MT4/MT5. Not to mention, you can see real-time price movements on the app.
Traders benefit from a wide range of currency pairs, various assets, and educational resources such as webinars and market analysis tools.
With a focus on providing quality services and support, amana is the preferred choice for investors who want to trade in Dubai and are seeking a reliable and rewarding forex trading experience, regardless if you are a beginner or a seasoned trader.
Happy trading!

